- Published on
Experience Editor Performance Troubleshooting While Upgrading to v10.4
- Authors

- Name
- Ben Sewards
- @BenjaminSewards
In this post, we deep dive into troubleshooting Sitecore Experience Editor performance issues during an upgrade to v10.4. Key steps include enabling telemetry, adjusting Solr settings, scaling resources, defragmenting databases, optimizing Sitecore configurations, and addressing caching and latency issues.
As of 11/7 performance improvements are still being discovered, so stay tuned for additional recaps!
Experience Editor Performance Troubleshooting
The Baseline 9.3 IaaS environment had already gone through significant rounds of performance tuning adjustments, including common optimizations such as:
- Data, Paths, and Item cache increases
- Disabled content testing
- ContentEditor.RenderCollapsedSections set to false
- Disable Suggested Tests in ribbon
- Disable Datasource usages count
- Disable Show Number of Locked Items
After our upgrade to v10.4 XM on PaaS, we were a bit unsettled with the less-performant results. EE Performance tests are performed by 20+ content authors running through the exact same actions every test. Each author stop-watched times for defined tasks such as add page reload, hard-cache page reload, add component with datasource, and modify component. Once the page becomes "editable" (e.g., the workflow blue ribbon appears), the stopwatch is stopped.
Performance profiling can be heavy handed and be a tough barrier to entry, but fear not, let's break it down into digestable pieces.

Round 1 - Chasing The 9.3 Baseline
The 1st round of performance testing on 10.4 was steam rolled by timeouts for even non-complex tests, such as pages with minimal componentry and simple page reloads.
To get to the root cause, I enabled the DependencyTrackingTelemetryModule within applicationinsights.config to see end-to-end transactions in Application Insights.
Add the exclude for HttpHeaders below due to the App Gateway stripping out the authentication header
<TelemetryModules>
    <Add Type="Microsoft.ApplicationInsights.DependencyCollector.DependencyTrackingTelemetryModule, Microsoft.AI.DependencyCollector">
        <ExcludeComponentCorrelationHttpHeadersOnDomains>
            <Add>core.windows.net</Add>
            <Add>core.chinacloudapi.cn</Add>
            <Add>core.cloudapi.de</Add>
            <Add>core.usgovcloudapi.net</Add>
            <Add>localhost</Add>
            <Add>127.0.0.1</Add>
        </ExcludeComponentCorrelationHttpHeadersOnDomains>
    </Add>
</TelemetryModules>
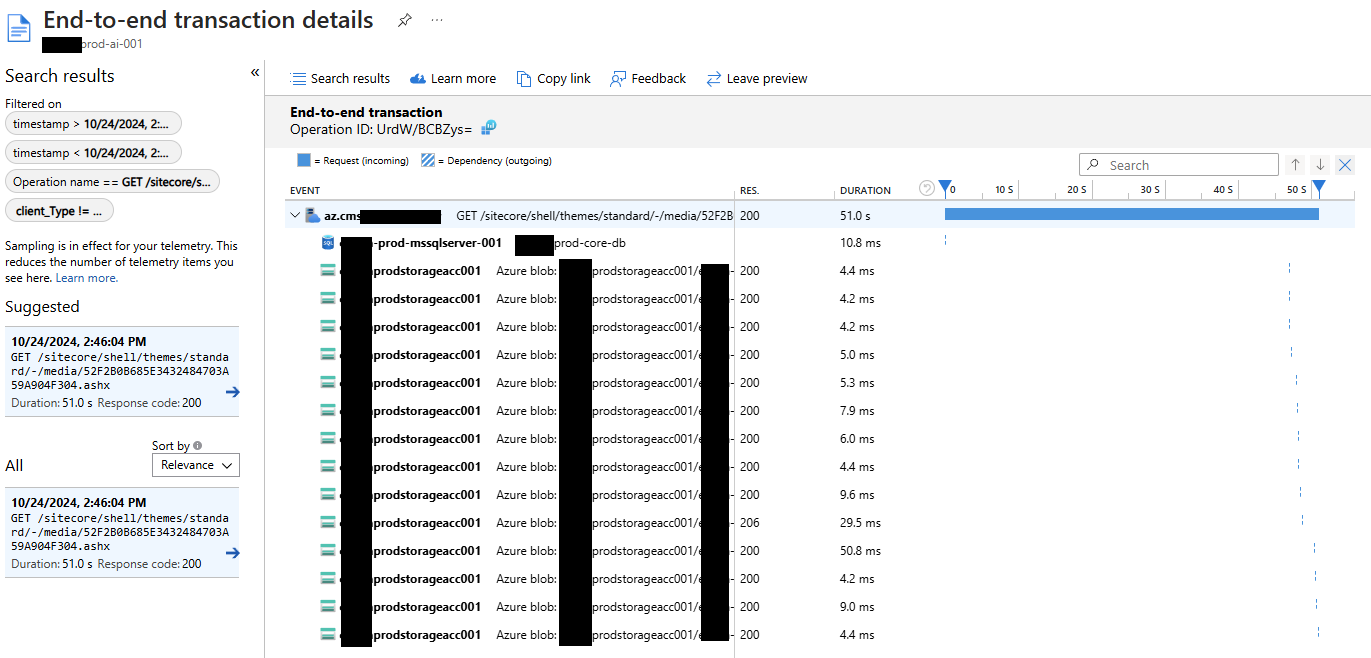
After the module is deployed, the E2E dependency telemetry data started to appear in Azure. Navigate to Application Insights > Performance > Select an operation to investigate:
 |
|---|
| Azure Application Insights showing E2E transaction details for a Sitecore Media Request operation. Notice the time taken within SQL is trivial. |
Resolving Timeouts
SOLR URI error - HttpParser - URI is too large > 8192 - SOLR
Solr Queries were appending security item read access checks for every role (and inherited role), so the GET Query sent to Solr was too long. Sitecore does have a config setting for switching calls to POST, but we were hesitant to make that switch. Instead, hop onto the Solr Cloud VM into ZooKeeper and increase the headerBufferSize. Increasing the buffer size solved the initial timeout issues but note that it's not a scalable solution as much as linear, so we could run into this issue again if too many roles are added.
I also configured a Solr retry strategy to aid in search and computed index field timeouts, since we were also seeing some index document failures that shouldn't normally fail, potentially because of network latency:
<!-- Configure the Solr retry strategy
	https://doc.sitecore.com/xp/en/developers/104/platform-administration-and-architecture/configure-the-solr-retry-strategy.html#enable-a-retryer-strategy
	-->
<solrRetryer type="Sitecore.ContentSearch.SolrProvider.Availability.Retryer.ExponentialRetryer, Sitecore.ContentSearch.SolrProvider" singleInstance="true" patch:instead="*[@type='Sitecore.ContentSearch.SolrProvider.Availability.Retryer.NoRetryRetryer, Sitecore.ContentSearch.SolrProvider']">
	<param desc="retryCount">3</param>
	<param desc="deltaBackoff">00:00:01</param>
	<param desc="maxBackoff">00:00:05</param>
	<param desc="minBackoff">00:00:01</param>
</solrRetryer>
504 Gateway Timeout
Simply increased the timeout (previously 20 seconds) to 120 seconds to match existing Load Balancers.
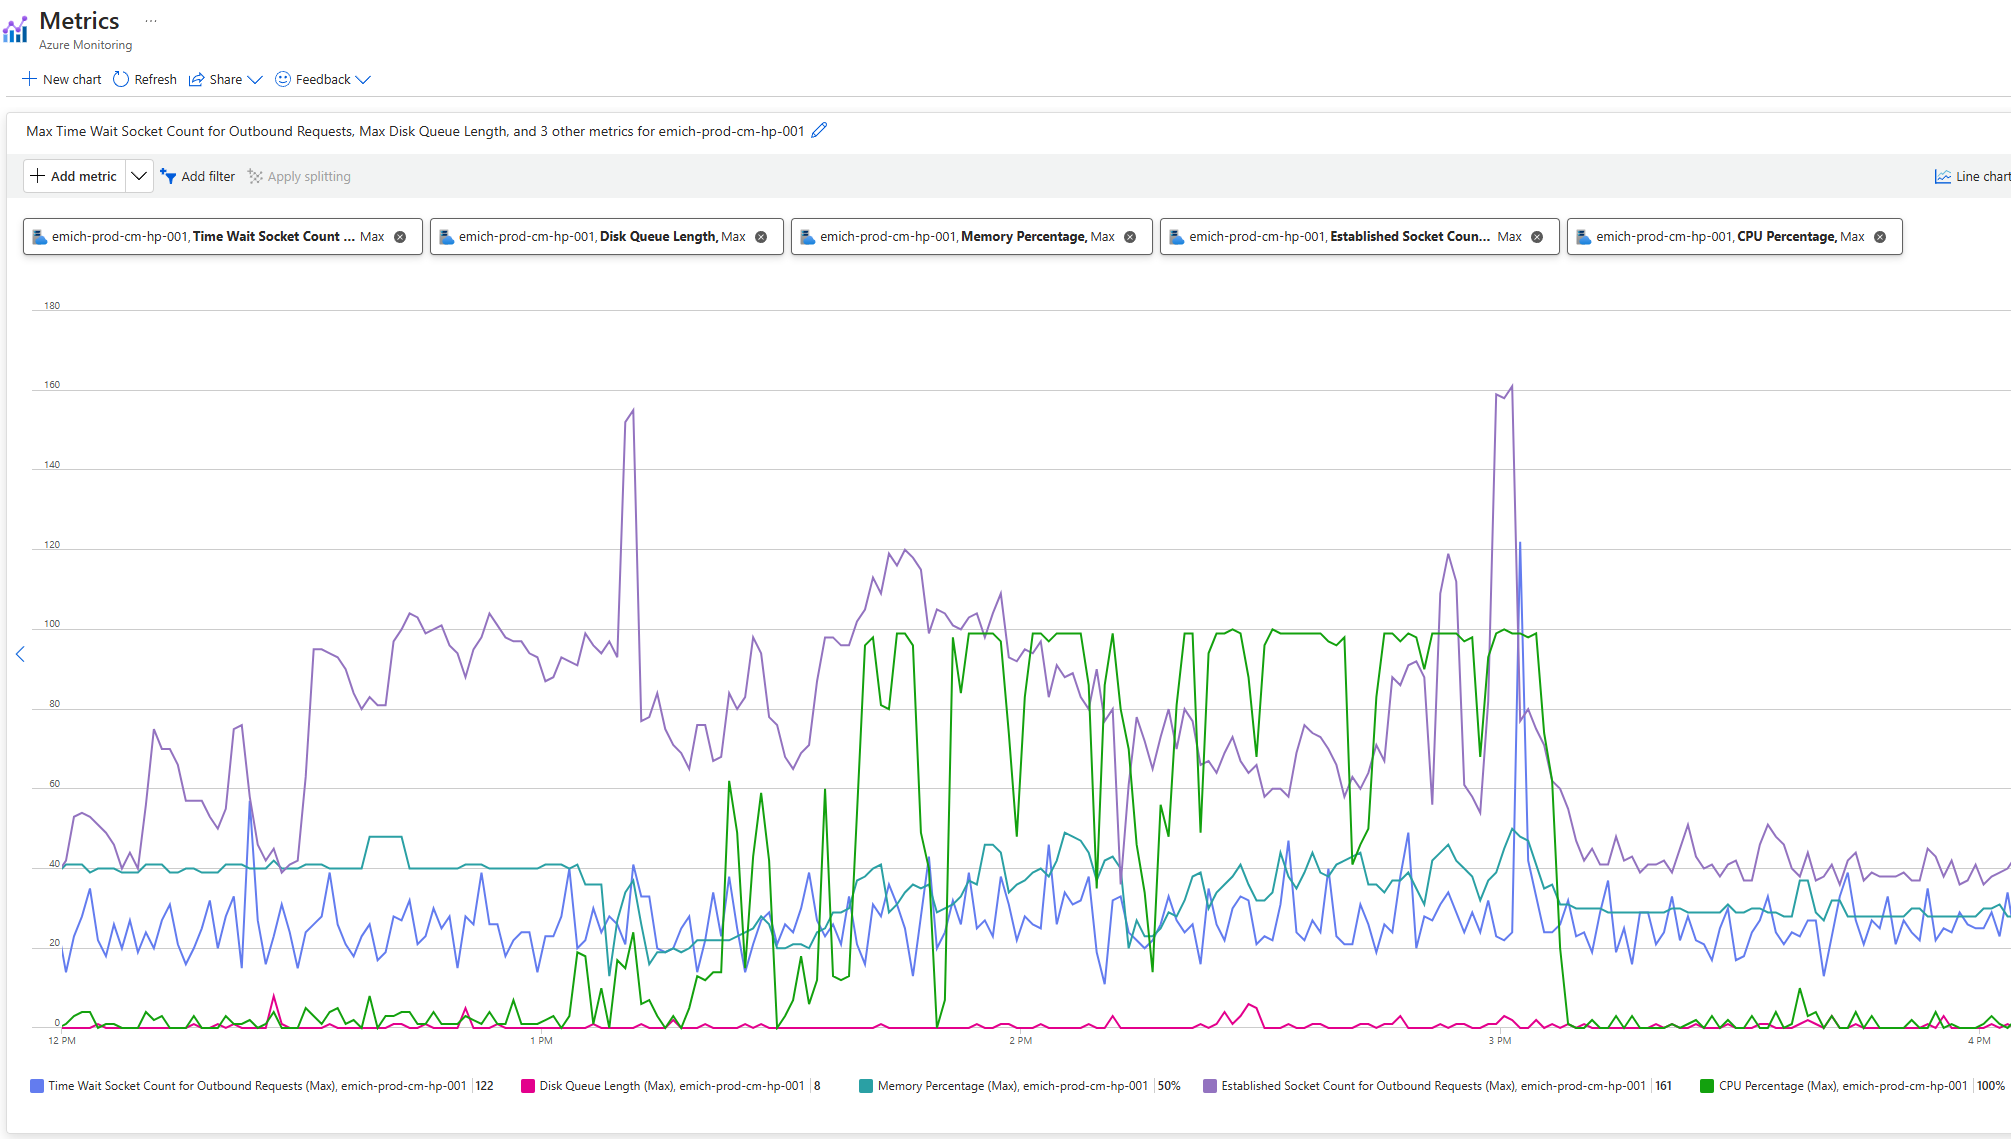
Scaling We noticed through Azure Monitor consistently high CPU Usage (90%+) during the performance testing, so we increased CPU size from 4 to 8 - P2V3 to P3V3.
 |
|---|
| Azure Monitor showing CPU Percentage metric, along with other App Service Plan Metrics |
Round 2 (Through 4 If I'm Being Honest)
Now that the long-winded timeouts are removed, we started to see some improvements, but alas most authors were still getting the dreadful "wait" dialog when adding a component or saving the page.
DB Defragmentation
We worked with the Database Administrator to set a schedule for database defragmentation since we noticed that the databases suffered from great fragmentation, commonly more than 90%+. Clustered indexes were set up for certain table's primary keys, which was were the worse fragmentation was present. The scheduled rebuilds for regular indexes in combination with the clustered index adjustments greatly reduced fragmentation:
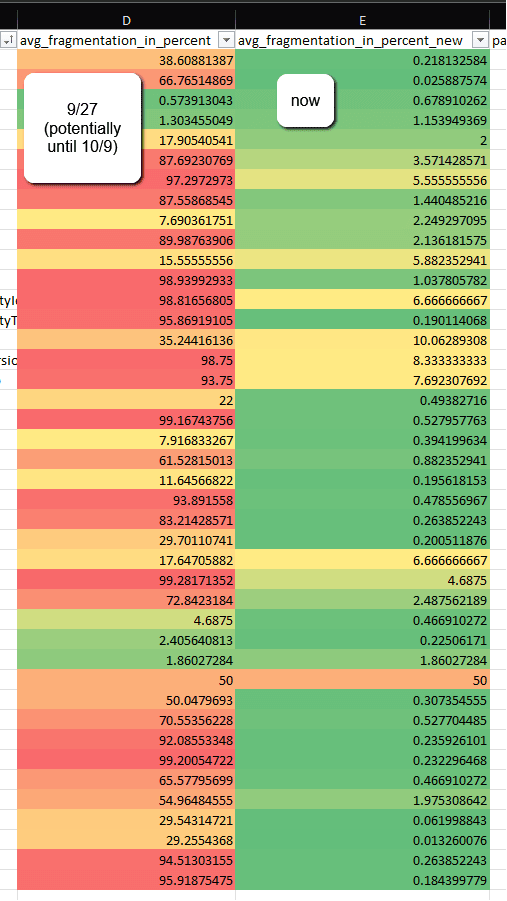
There's plenty of great articles about database fragmentation and clustered indexes, but I found this article by Mikael Högberg to be the most in-depth and encompassing.
Sitecore Configuration Adjustments
Increased RequestQueueLimitPerSession from 25 to 100 to account for a larger number of requests being made to the server within a single session. Then change autoflush and useGlobalLock to false.
<!-- Web.config: Throttle concurrent requests per session specify how many requests with same Session ID are allowed to be executed simultaneously. -->
<add key="aspnet:RequestQueueLimitPerSession" value="100" />

<!-- Prevent log entries from blocking any operations, even minimally -->
<system.diagnostics>
	<trace autoflush="false" useGlobalLock="false" indentsize="0">
		...
	</trace>
</system.diagnostics>
Enabled AccessResultCache, disable Counters, and Increase Item Usages Cache:
<!-- Patch config: Disable Settings for CM Only -->
<settings role:require="Standalone OR ContentManagement">
	<setting name="Caching.CacheKeyIndexingEnabled.AccessResultCache" value="true" />
	<setting name="Counters.Enabled" value="false"/>

	<setting name="WebEdit.ItemUsagesCacheSize">
	<patch:attribute name="value">100MB</patch:attribute>
	</setting>
</settings>
EE Ribbon
I noticed through content author HAR files that Sitecore makes a speak request per Ribbon command to check whether the user can execute a command. With over 20 Ribbon commands in the top-toolbar, I was seeing over 25 seconds of blocking time before the page became editable. I decided to restrict read-access to SXA Site Author to the following commands in the core database, saving 8+ seconds of "canExecute" time:

The commands can be found in the Core database located under /sitecore/content/Applications/WebEdit/Ribbons/WebEdit/Experience Accelerator.
Dianoga Upgrade
I found that a Dianoga upgrade from v5.0.1 wasn't necessary at first to support Sitecore 10.4, but profile traces with PerfView were showing Dianoga.MediaCacheAsync.OptimizingMediaCache.AddStream taking upwards of 8 seconds for larger images.
After reading more into the releases, I settled on upgrading to v5.4.1 to make sure that the app had the performance improvements and image compression upgrades (mozjpeg, libwebp, etc.).
Media Thumbnail Processing
Some authors modified the RTE component by adding an image. When this occurred, they would have to go into the select media dialog and navigate through the content tree under the media library/[SITE]. The expanding of this directory took upwards of 15+ seconds and seemed to stall other users.
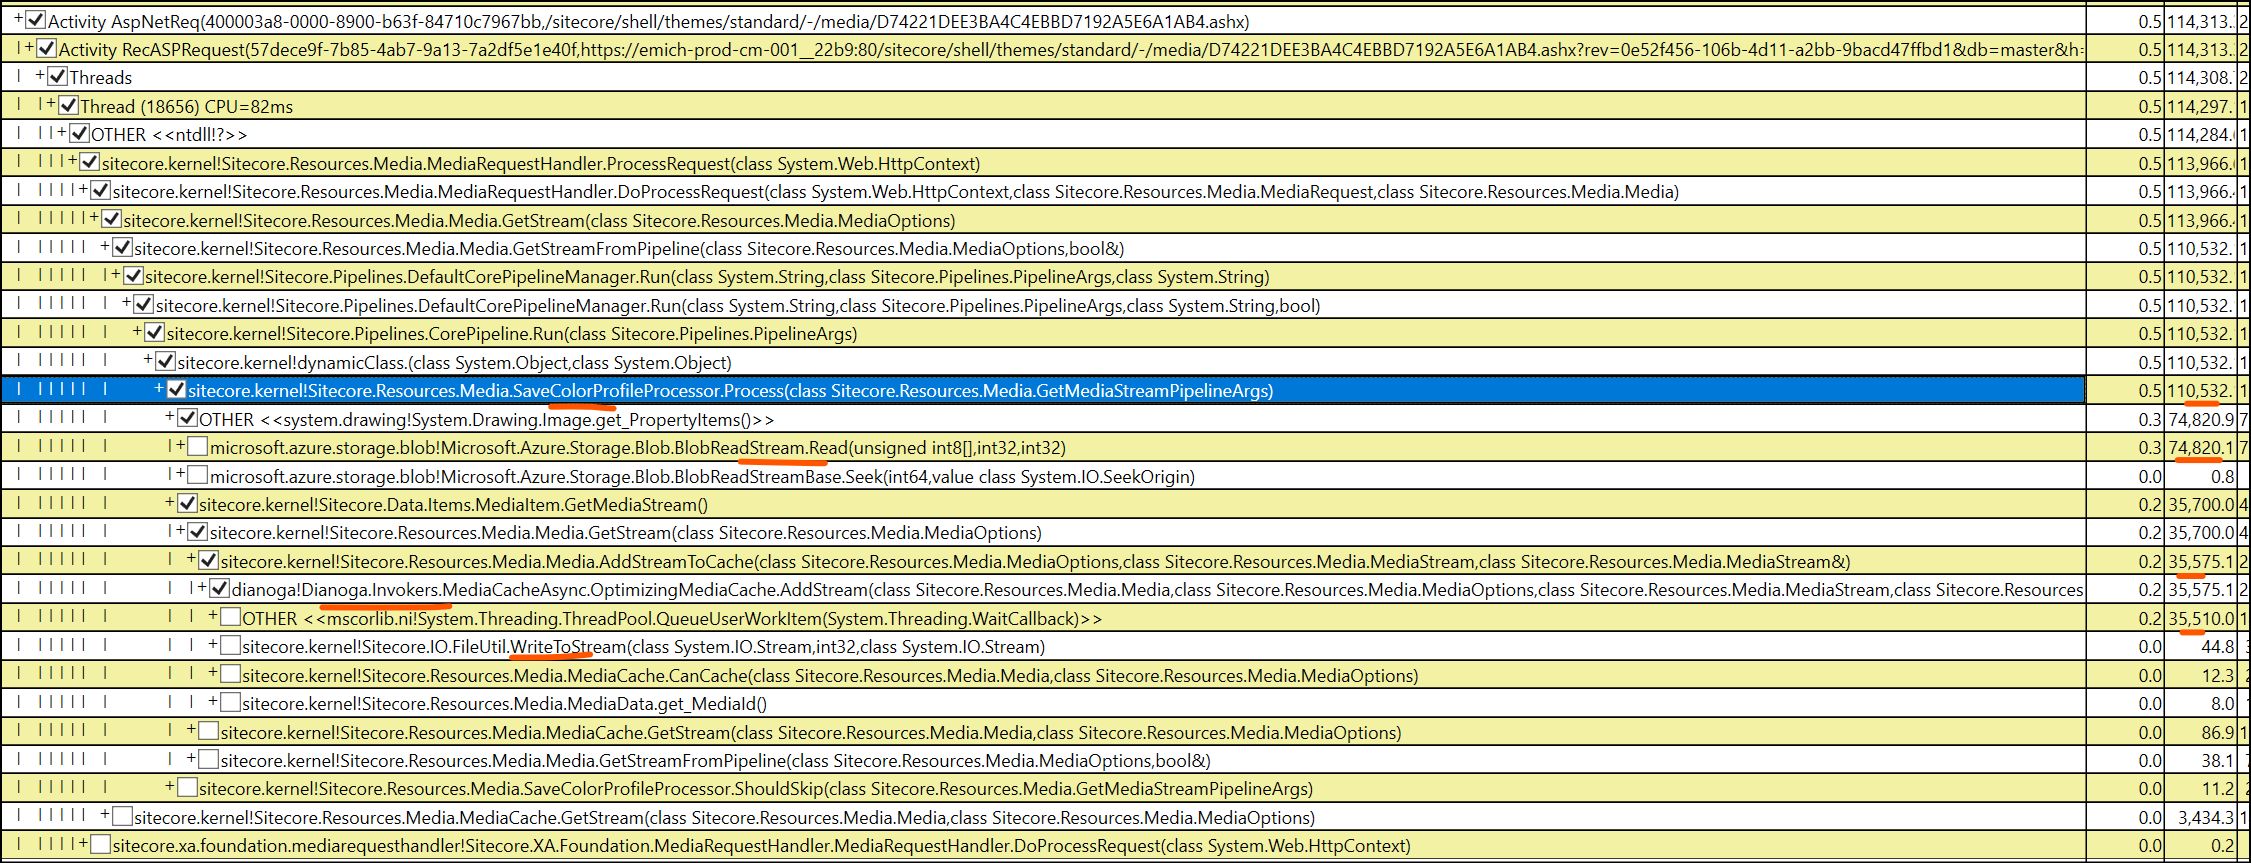
Profiling via Kudu Tools on the CM App Service provided insight into the thread timing between the Sitecore Processors, shedding some light into the culprit, SaveColorProfileProcessor:
 |
|---|
| PerfView > CPU Stacks > w3wp (select the right PID, usually has highest memory set) > Select CallTree tab > expand down into the abyss of threads until you find a Sitecore namespace OR search for it.. |
Dotpeek reveals that this Sitecore processor opens up a memory stream to process the image and save an args property, ColorProfile. This property doesn't seem to be used elsewhere in-between the getMediaStream processors, unless you're using Sitecore DAM, so I assume it's safe to remove for XM, with the following patch:
<!--
	Remove ColorProfile processors to reduce media stream threads and duration of processing tree-view thumbnails
-->
<configuration xmlns:patch="http://www.sitecore.net/xmlconfig/" xmlns:set="http://www.sitecore.net/xmlconfig/set/">
  <sitecore>
    <pipelines>
      <getMediaStream>
        <processor type="Sitecore.Resources.Media.SaveColorProfileProcessor, Sitecore.Kernel" resolve="true">
          <patch:delete />
        </processor>
        <processor type="Sitecore.Resources.Media.RestoreColorProfileProcessor, Sitecore.Kernel">
          <patch:delete />
        </processor>
      </getMediaStream>
    </pipelines>
  </sitecore>
</configuration>
Cumulative Hotfix
Sitecore recently provided a cumulative hotfix for v10.4. The release notes mention a fix for MediaRequestHandler ignoring cacheability, so it's best that that gets included in the project.
- 619349 Security enhancement
- 618639 MediaRequestHandler ignores value of MediaResponse.Cacheability setting
- 614821 Performance degradation when resolving Standard Values token value for a fallback version of a cloned item
Media Requests Excluded From Browser Caching
Once again looking at the HAR files, I noticed on v9.3 all /shell/-/media requests were being cached with Cache-Control: public, not only thumbnails and images, but also SXA JavaScript and Stylesheet SXA Theme items. On v10.4, even with the cumulative hotfix applied, we still were seeing no-cache for these requests.
Sitecore provides the following setting that would instruct the browser to not cache requests and instead always fetch from the server. Even with the setting set to false, it did not change how the shell site operated:
<setting name="DisableBrowserCaching" value="false" />
Sitecore also provides a setting for enabling media cache, but this setting just acts as a flag for whether Sitecore should cache media items and place them into the media cache directory server-side:
<setting name="Media.CachingEnabled" value="true" />
To resolve this discrepancy, I ended up adding a new processor, SetMediaRequestCacheHeaders, that overrides the previously set cache-control to private when media requests come from shell:
/*
	* Override the previously set cache-control to "private" from no-cache, no-store when media request comes from shell (EE, CE)
	*/
public class SetMediaRequestCacheHeaders : ProcessMediaRequestHeadersProcessor
{
	public override void Process(MediaRequestHeadersArgs args)
	{
		if (args?.Context?.Response?.Cache == null)
			return;
		var request = args.Context.Request;
		if (request == null || !args.Context.Request.Url.AbsolutePath.Contains("sitecore/shell"))
			return;
		var cache = args.Context.Response.Cache;
		var noStoreFieldInfo = cache.GetType().GetField("_noStore", System.Reflection.BindingFlags.Instance | System.Reflection.BindingFlags.NonPublic);
		var cacheabilityFieldInfo = cache.GetType().GetField("_cacheability", System.Reflection.BindingFlags.Instance | System.Reflection.BindingFlags.NonPublic);
		noStoreFieldInfo.SetValue(cache, false);
		cacheabilityFieldInfo.SetValue(cache, HttpCacheability.Public);
	}
}
<configuration xmlns:patch="http://www.sitecore.net/xmlconfig/">
  <sitecore>
    <pipelines>
      <mediaRequestHeaders>
        <processor type="Project.Sitecore.Processors.SetMediaRequestCacheHeaders, Project.Sitecore"/>
      </mediaRequestHeaders>
    </pipelines>
  </sitecore>
</configuration>
Compiler Upgrade
Missed during our initial upgrade was an upgrade to the DotNet compiler. With the upgrade to .NET 4.8, we can upgrade to v4.1.0.
Replacement CodeDOM providers that use the new .NET Compiler Platform ("Roslyn") compiler as a service APIs. Even if this doesn't have an effect on EE performance, we can now use new language features and improved compilation performance.
<package id="Microsoft.CodeDom.Providers.DotNetCompilerPlatform" version="4.1.0" targetFramework="net48" />
<!-- Web.config: add required compiler references -->
<system.codedom>
<compilers>
<compiler language="c#;cs;csharp" extension=".cs" type="Microsoft.CodeDom.Providers.DotNetCompilerPlatform.CSharpCodeProvider, Microsoft.CodeDom.Providers.DotNetCompilerPlatform, Version=4.1.0.0, Culture=neutral, PublicKeyToken=31bf3856ad364e35" warningLevel="4" compilerOptions="/langversion:default /nowarn:1659;1699;1701" />
<compiler language="vb;vbs;visualbasic;vbscript" extension=".vb" type="Microsoft.CodeDom.Providers.DotNetCompilerPlatform.VBCodeProvider, Microsoft.CodeDom.Providers.DotNetCompilerPlatform, Version=4.1.0.0, Culture=neutral, PublicKeyToken=31bf3856ad364e35" warningLevel="4" compilerOptions="/langversion:default /nowarn:41008 /define:_MYTYPE=\"Web\" /optionInfer+" />
</compilers>
</system.codedom>
Reduce Trace Logging
Application Insights telemetry data can make a lot of noise, adding up to your overall performance output, and fill up your storage quick if you're not careful with how the log4net appenders are set up.
To reduce the noise, set the root priority from INFO to WARN and add in some filters for telemetry data that you don't want to be processed and sent to AI:
<sitecore>
	<log4net>
		<root>
		<priority>
			<patch:attribute name="value">WARN</patch:attribute>
		</priority>
		</root>
	</log4net>
	<appender name="LogFileAppender" type="log4net.Appender.RollingFileAppender, Sitecore.Logging">
		<filter type="log4net.Filter.StringMatchFilter" desc="filter1">
			<stringToMatch value="Start processing HTTP request GET" />
			<acceptOnMatch value="false" />
		</filter>
		<filter type="log4net.Filter.StringMatchFilter" desc="filter1A">
			<stringToMatch value="Start processing HTTP request POST" />
			<acceptOnMatch value="false" />
		</filter>
		<filter type="log4net.Filter.StringMatchFilter" desc="filter2">
			<stringToMatch value="Sending HTTP request GET" />
			<acceptOnMatch value="false" />
		</filter>
		<filter type="log4net.Filter.StringMatchFilter" desc="filter2A">
			<stringToMatch value="Sending HTTP request POST" />
			<acceptOnMatch value="false" />
		</filter>
		<filter type="log4net.Filter.StringMatchFilter" desc="filter3">
			<stringToMatch value="Received HTTP response after" />
			<acceptOnMatch value="false" />
		</filter>
		<filter type="log4net.Filter.StringMatchFilter" desc="filter4">
			<stringToMatch value="End processing HTTP request after" />
			<acceptOnMatch value="false" />
		</filter>
	</appender>
</sitecore>
Blue-Green Caveat
If you've implemented Blue-Green strategy and find yourself having a Green CM (App Service Slot), know that the slot shares computed resources with the live production slot.
We discovered that the green slot was hogging over 40% CPU at the time of EE Performance Testing. It's recommended to keep the slot on standby until it's needed during deployment. Also make sure to follow Sitecore's guide on Configuring Multiple CM Instances.
SQL Testing
To test SQL performance directly from the CM, I created a SQL Test ASPX page that simply iterates over SQL commands given a # of iterations per command and records the stopwatch elapsed time:
<%@ Page Language="c#" EnableEventValidation="false" AutoEventWireup="true" %>
<%@ Import namespace="System" %>
<%@ Import Namespace="System.Configuration" %>
<%@ Import Namespace="System.Diagnostics" %>
<%@ Import Namespace="System.Data.SqlClient" %>
<%@ Import namespace="System.Collections.Generic" %>
<%@ Import namespace="System.IO" %>
<%@ Import namespace="System.Linq" %>
<%@ Import namespace="System.Text" %>
<%@ Import namespace="System.Web" %>
<%@ Import namespace="System.Web.UI" %>
<%@ Import namespace="System.Web.UI.WebControls" %>
<%@ Import namespace="Sitecore.Data.Items" %>
<%@ Import namespace="Sitecore.Resources.Media" %>
<%@ Import namespace="Sitecore.Sites" %>
<%@ Import Namespace="Sitecore.Data.SqlServer" %>

<script runat="server">
    protected void RunSqlQueries_Click(object sender, EventArgs e) {
        var timer = new Stopwatch();
        var connString = System.Configuration.ConfigurationManager.ConnectionStrings["master"].ConnectionString;
        var output = string.Empty;

        List<dynamic> queryStrings = new List<dynamic>
            {
                new
                {
                    query = "SELECT TOP (100) * FROM Items",
                    iterations = 5000
                },
                new
                {
                    query = @"SELECT TOP (100) * FROM VersionedFields WHERE Value like '%<p>%'",
                    iterations = 1000
                }
            };

            using (SqlConnection connection = new SqlConnection(connString))
            {
                connection.Open();

                // foreach query string
                foreach (dynamic s in queryStrings)
                {
                    SqlCommand command = new SqlCommand(s.query, connection);

                    // run query 1k times
                    timer.Restart();
                    for (int i = 0; i <= s.iterations; i++)
                    {
                        SqlDataReader reader = command.ExecuteReader();
                        reader.Close();
                    }
                    output = output + $" > Time in ms: {timer.ElapsedMilliseconds}";
                    timer.Stop();
                }
            }
        lt.Text = output;
    }
</script>

<!DOCTYPE html>
<html xmlns="http://www.w3.org/1999/xhtml">
    <head runat="server">
        <title>SQL Tester</title>
        <link rel="Stylesheet" type="text/css" href="/sitecore/shell/themes/standard/default/WebFramework.css" />
        <link rel="Stylesheet" type="text/css" href="./default.css" />
        <style type="text/css">
        </style>
    </head>
    <body>
        <form id="Form1" runat="server" class="wf-container">
            <div class="wf-content">
                <h1>
                    <a href="/sitecore/admin/">Administration Tools</a> - SQL Perf Test
                </h1>
                <br />
                <asp:Button runat="server" ID="btn" Text="Perform Test" OnClick="RunSqlQueries_Click" />
                <br />
                <asp:Literal runat="server" ID="lt"></asp:Literal>
            </div>
        </form>
    </body>
</html>
PaaS vs IaaS Platform Performance
For all the great features within Azure PaaS that can be configured at the switch of a button, we are then reminded of the platform induced pitfalls.
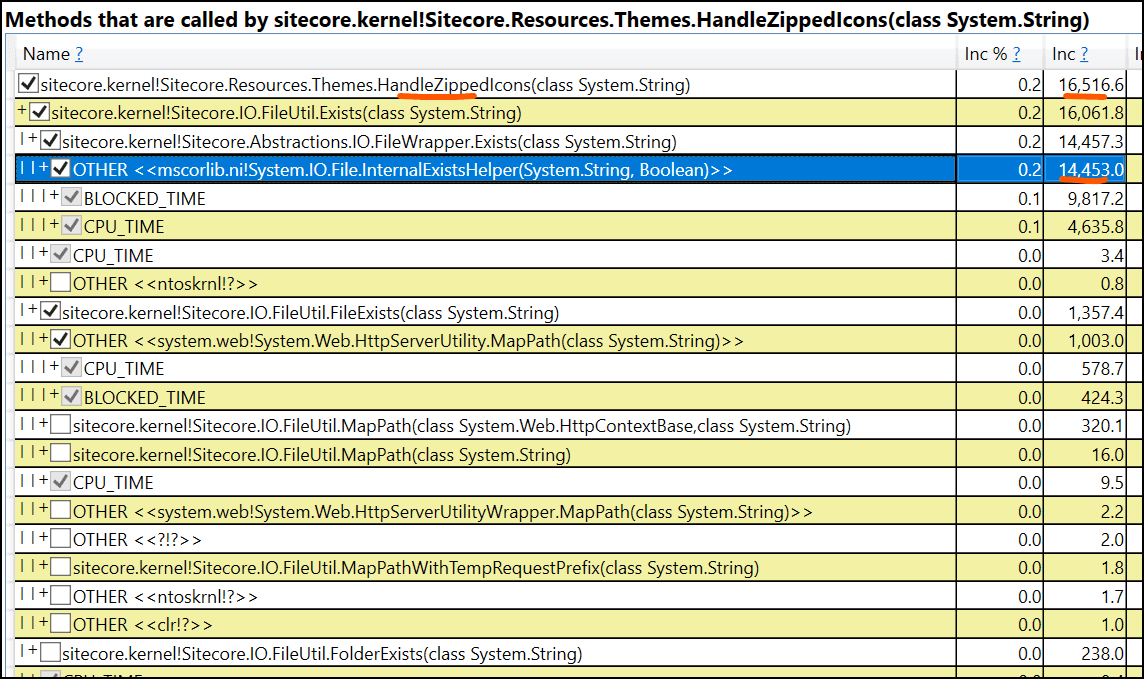
Digging through the traces of the authors saving their pages in EE, 90% of the cumulative time within a process called HandleZippedIcons was spent on File exists method in the Azure filesystem:
This same process looks totally different on a VM where the cost of the same function is only about 35%:
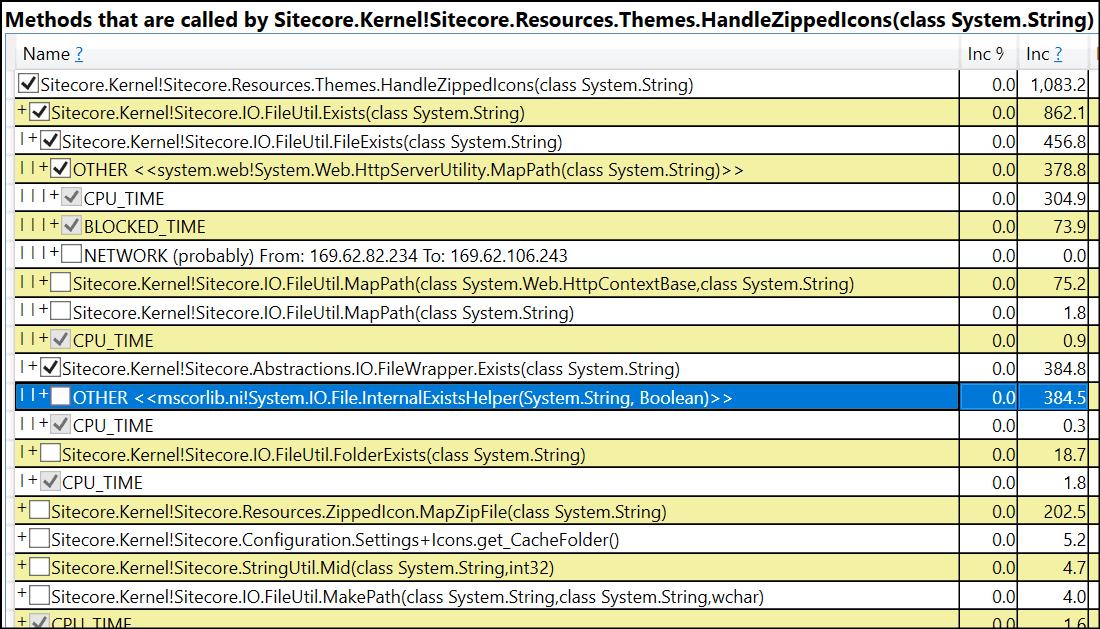
This difference suggests that I/O operations on PaaS are taking more than twice as long compared to a VM of similar compute power.
Latency Checks
Our infrastrcture was set up within a Private VNet, but the Azure Blob Storage wasn't configured with NIC to send traffic through the Azure backbone, so there is a certain level of latency to expect from hopping through Azure's Public Network.
Looking closer at Blob storage performance in Azure, the E2E latency of GetBlob averaged 73ms compared to the actual server latency of 17ms during the dated performance testing. An E2E much higher than a Success Server Latency means the time it took Sitecore to send the request and receive the response was held up outside the application:
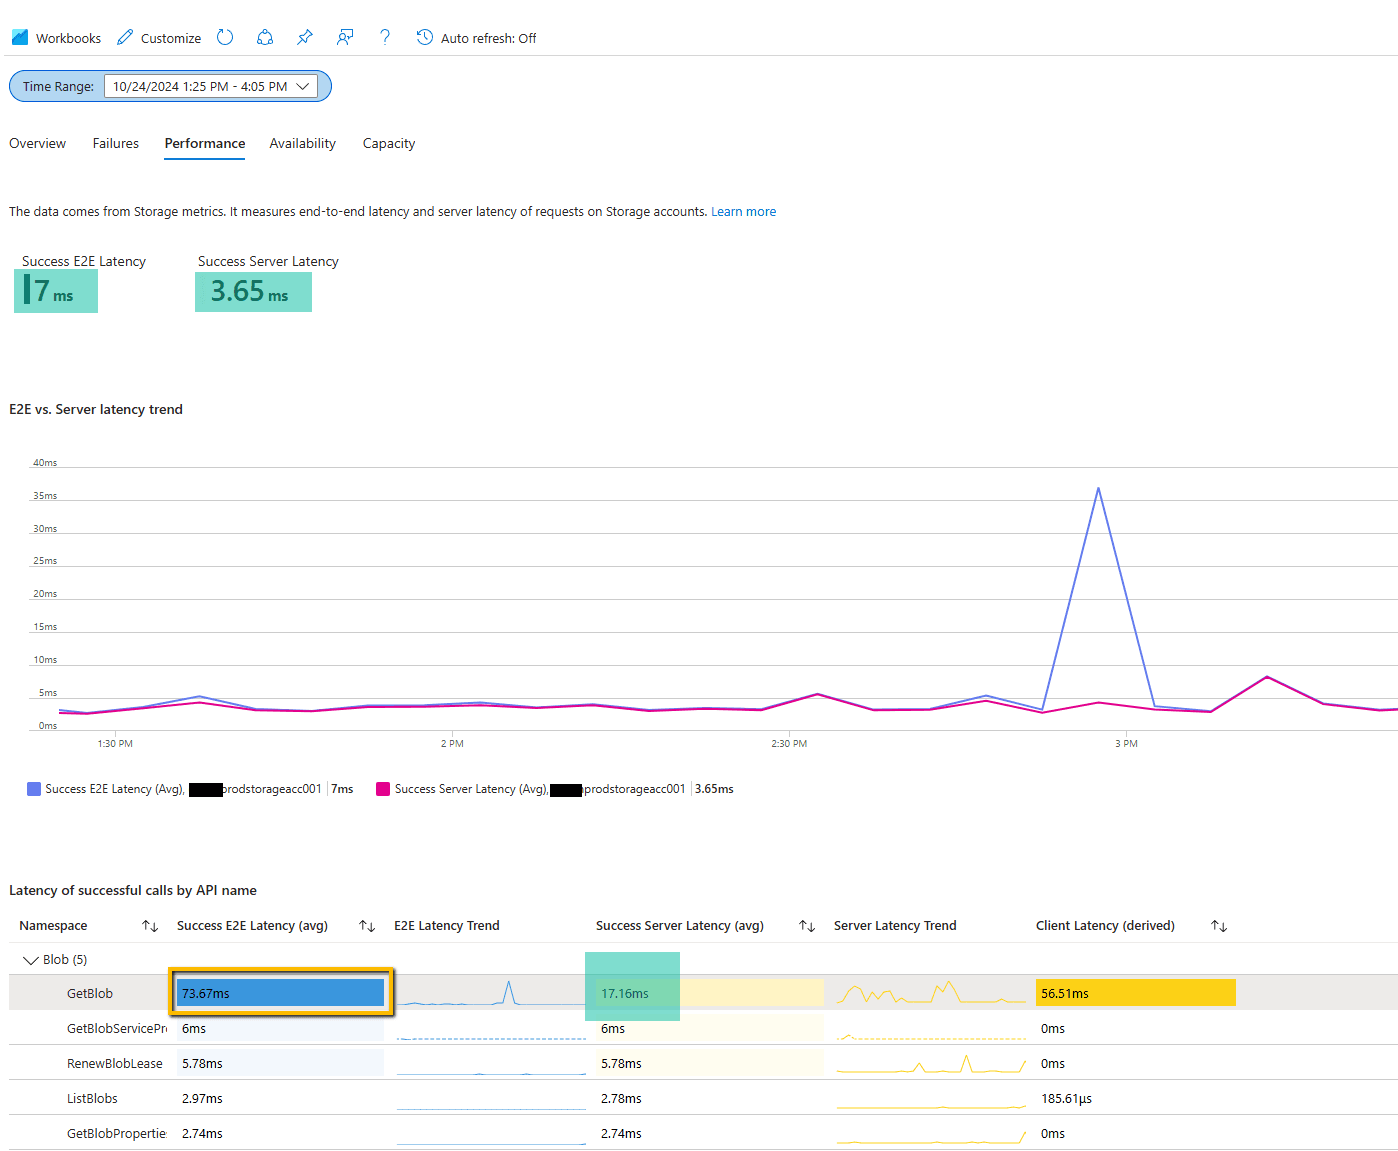
Once the Network was configured for blob storage, I started noticing a visible difference of ~200ms on thumbnail media requests when expanding the media library.
Closing The Gap
Experience Editor performance requires a never-ending cycle of adjustments as a Sitecore CM scales upward in page complexity.
We've touched on addressing various performance issues through telemetry, Solr settings adjustments, resource scaling, database defragmentation, configuration optimizations, and caching improvements. By systematically identifying and resolving bottlenecks, significant performance gains can be achieved, ensuring a smoother and more efficient content authoring experience.